


A sophisticated tool for analyzing trending cryptocurrency tokens across multiple timeframes using the GMGN.ai wrapper. The analyzer aggregates data, filters tokens based on key metrics, and provides visual analytics along with expert analysis.
- 📊 Multi-timeframe token trend analysis (1m, 5m, 1h, 6h, 24h)
- 📈 Data aggregation and filtering based on volume, market cap, and consistency
- 🎨 Automated visualization generation
- ⏳ Continuous monitoring with automated refresh
- Fetches trending tokens across multiple timeframes
- Collects key metrics:
- 🆔 Token ID, 🔗 Chain, 🏠 Address
- 🔤 Symbol, 💰 Price, 📊 Volume
- 🌎 Market Cap, 📉 Price Change Percentage
- 🚨 Error handling for API requests
- 🔍 Validation of token data integrity
- Groups tokens by address
- Calculates key aggregated metrics:
- 📈 Average price and volume
- 📏 Median market cap
- 🔀 Price change trends
- 🔁 Consistency count (appearance across timeframes)
- Filtering criteria:
- ✅ Minimum volume threshold: 1000
- ✅ Minimum market cap threshold: 10000
- ✅ Minimum consistency count: 3 timeframes
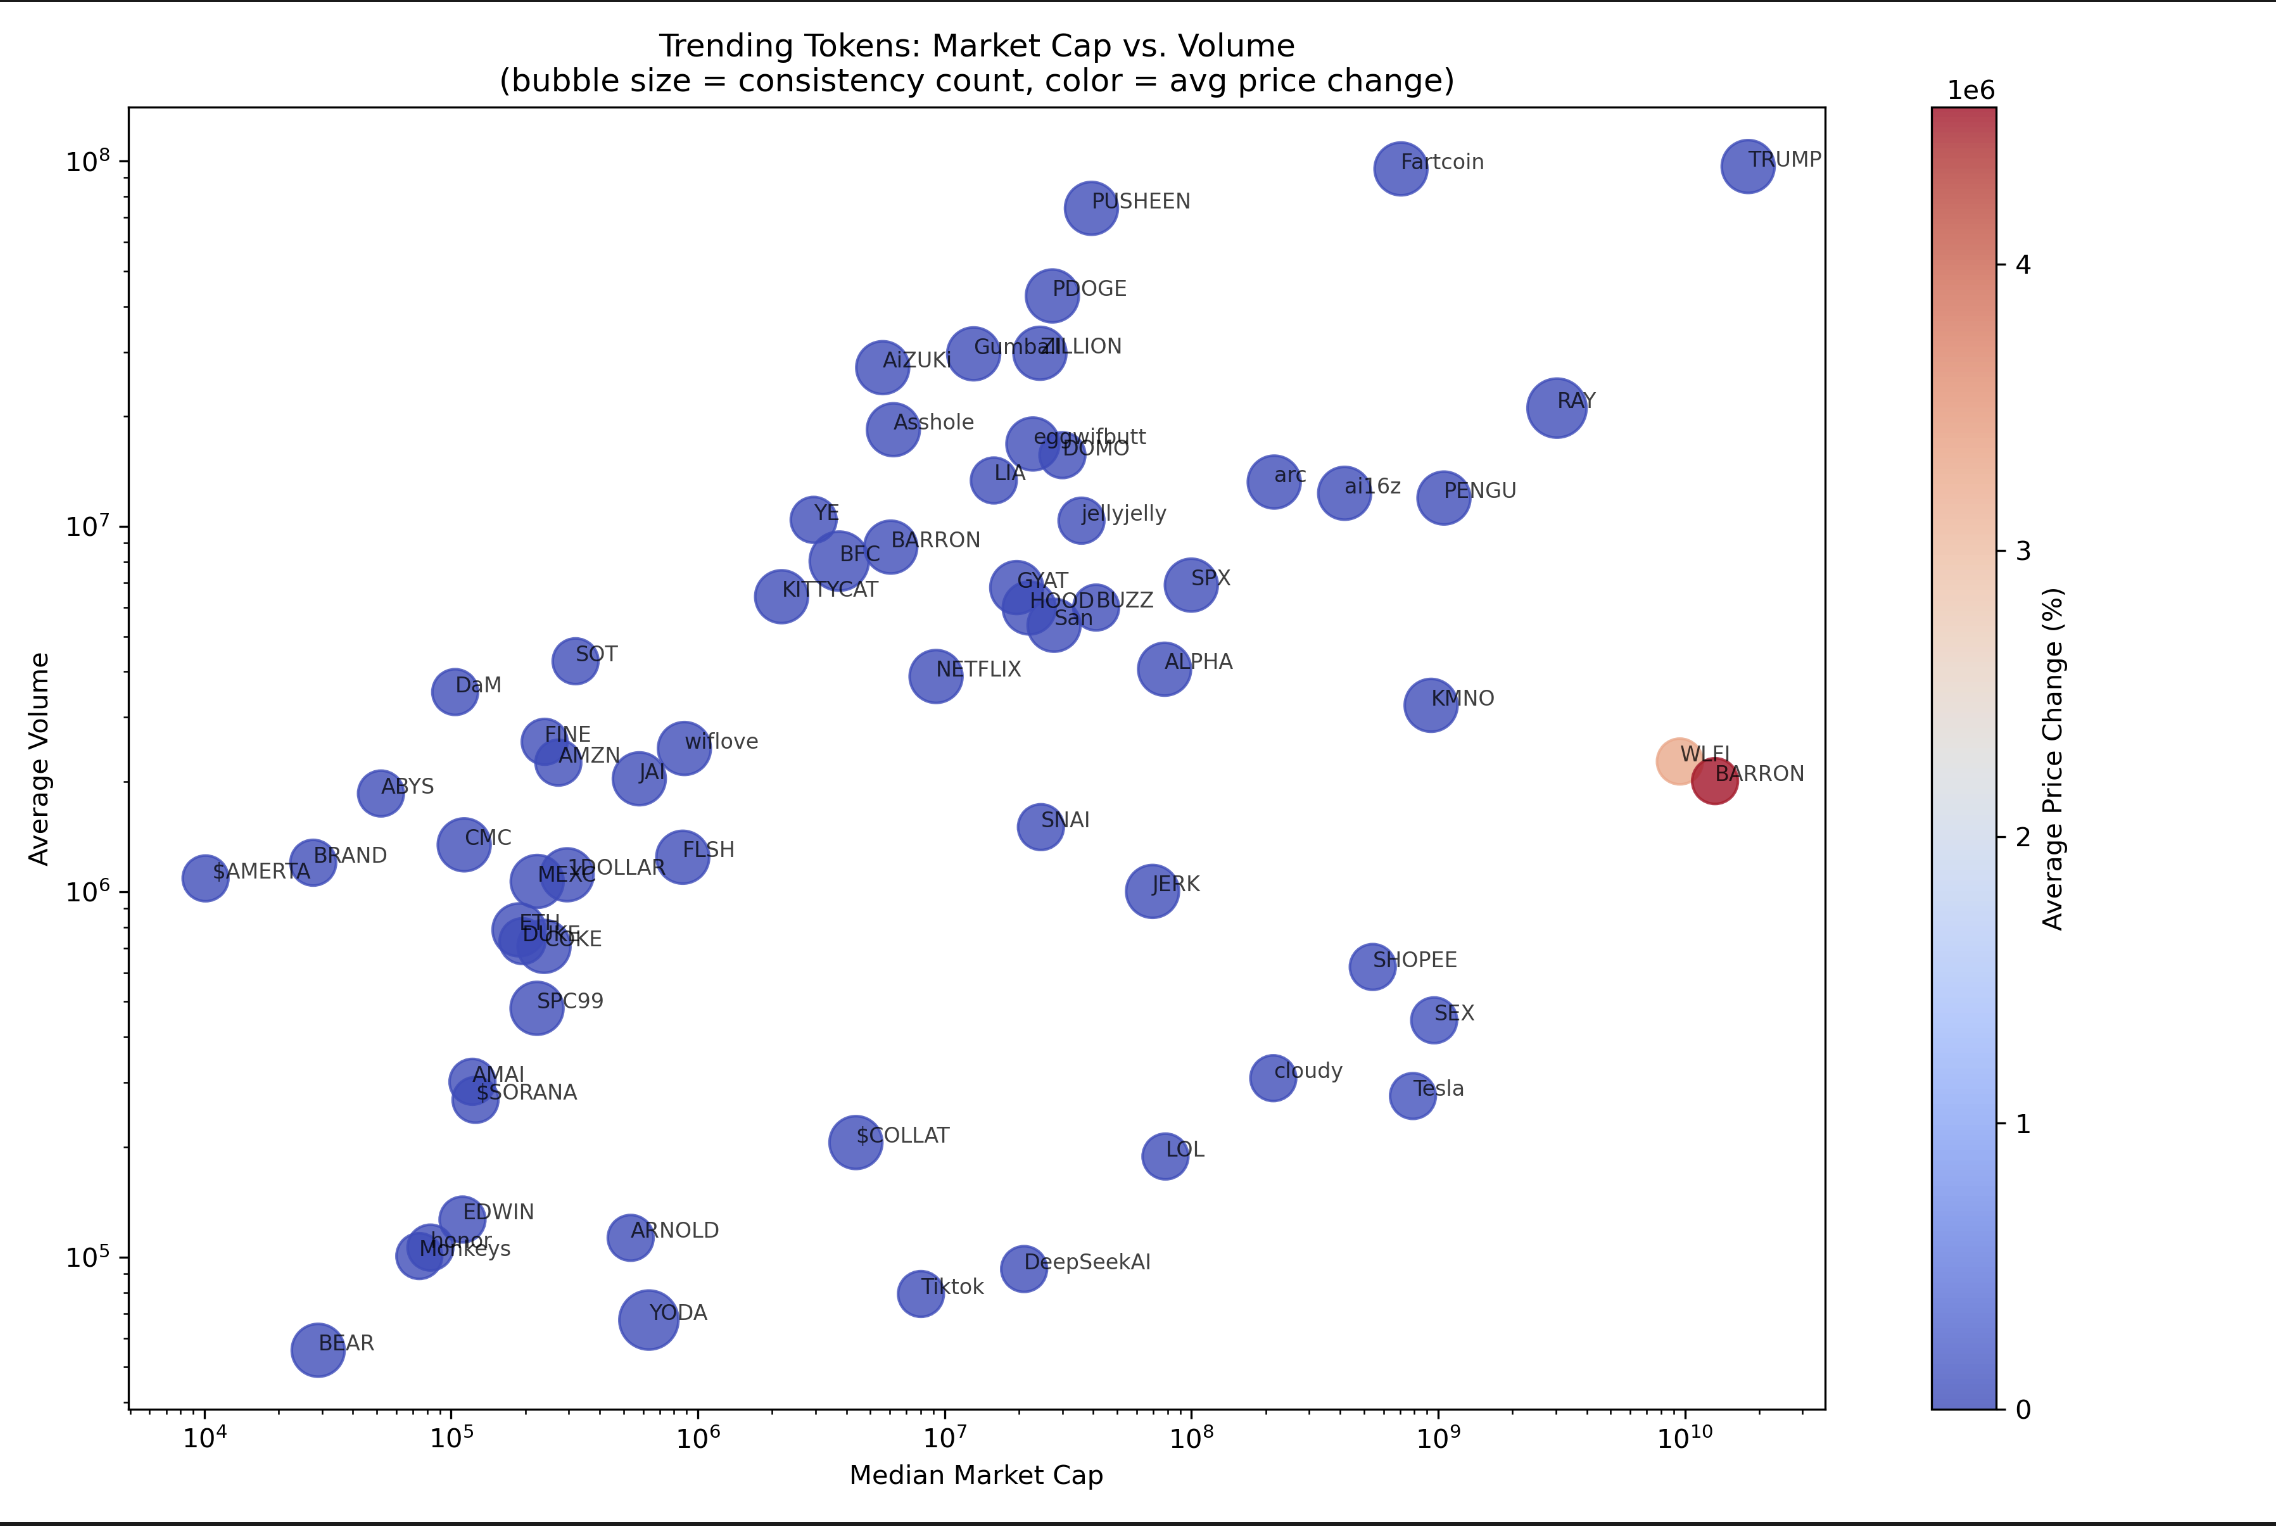
- Generates scatter plot visualization:
- 📍 X-axis: Median Market Cap (log scale)
- 📍 Y-axis: Average Volume (log scale)
- 🎈 Bubble size: Consistency count
- 🎨 Color gradient: Average price change
- 🔤 Includes token symbol annotations
- 🖼️ Saves high-resolution plot (300 DPI)
1️⃣ Clone the repository:
git clone https://github.com/yllvar/gmgn-TrendingAnalyzer.git
cd gmgn-TrendingAnalyzer
2️⃣ Create and activate a virtual environment (optional but recommended):
python -m venv venv
source venv/bin/activate  # On Windows: venv\Scripts\activate
3️⃣ Install dependencies:
pip install -r requirements.txtRun the analyzer:
python analyzer.pyThe script will:
- 📡 Fetch trending tokens every 60 seconds
- 🧠 Generate analysis and visualizations
- 🖼️ Save plots as ‘trending_analysis_plot.png’
- 📑 Save analysis as ‘trending_analysis.csv’
- 🖥️ Display token data and analysis in the console
To stop the script, press Ctrl+C.
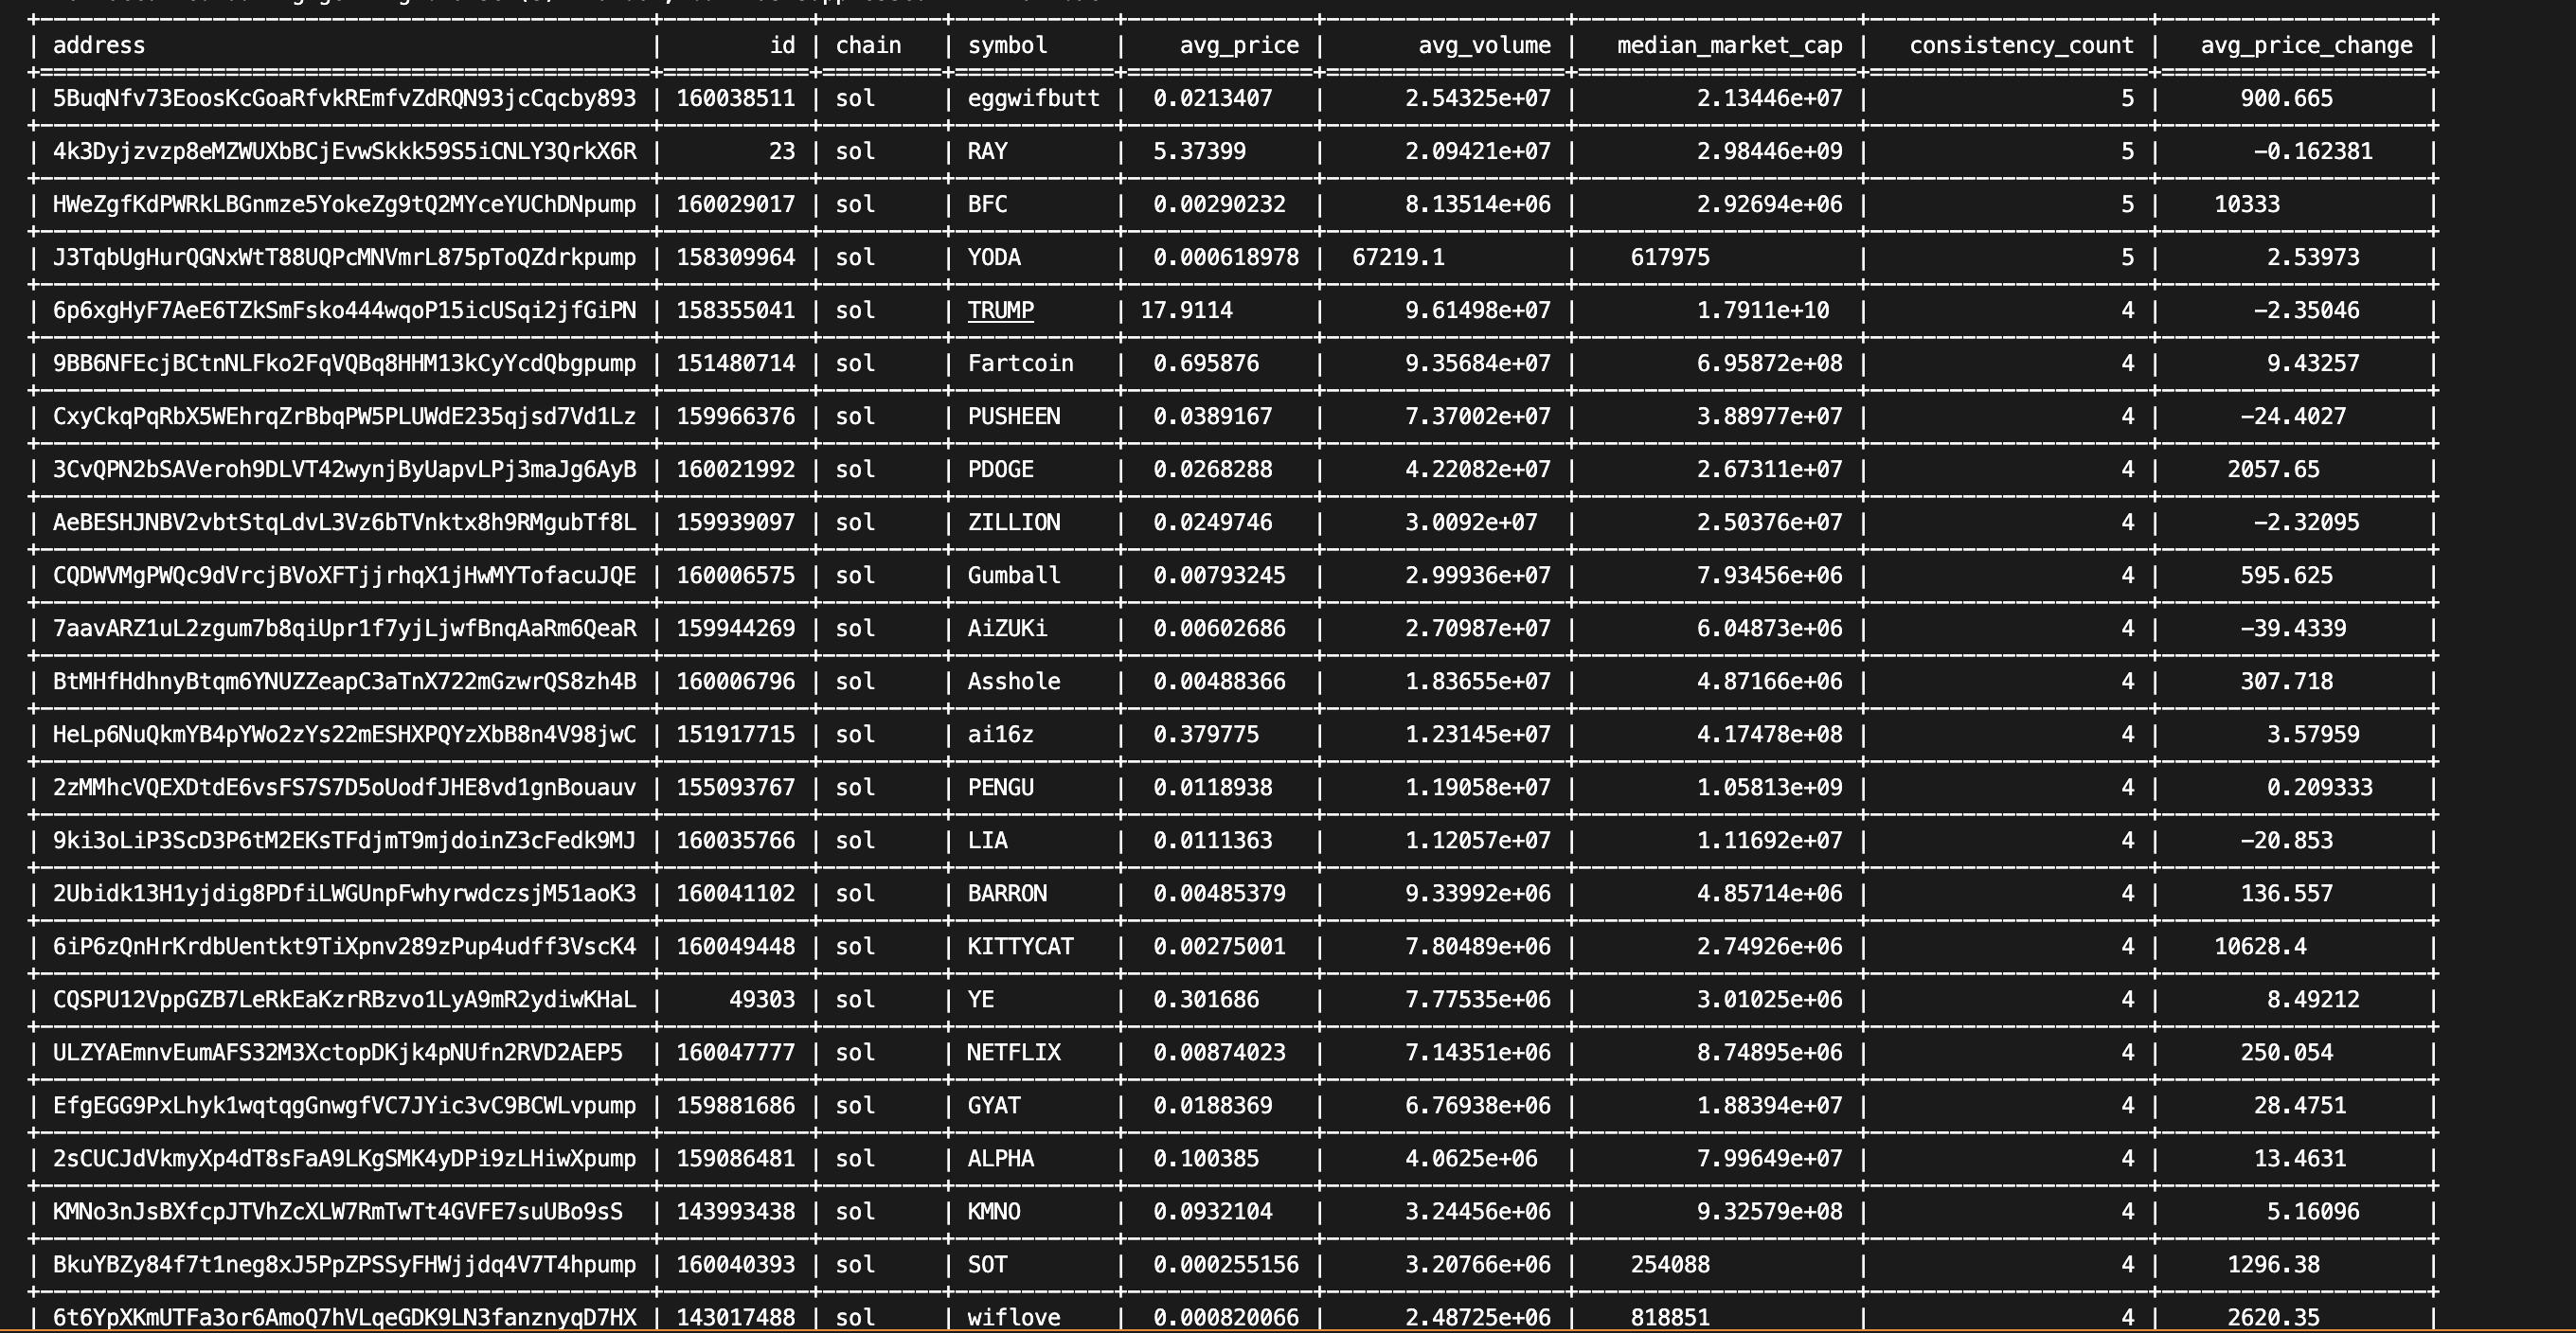
The analyzer produces:
- 📑 Tabulated token data with key metrics
- 🔗 List of token addresses for easy reference
- 📊 Visual plot saved as
'trending_analysis_plot.png'
- 🐍
pandas– Data manipulation and analysis - 📊
matplotlib– Data visualization - 📜
tabulate– Console table formatting - 🔑
python-dotenv– Environment variable management
This project is based on the work of 1f1n and his repository: gmgnai-wrapper.
Big shoutout to 1f1n for his amazing work! 🙌
Feel free to fork this repository, make improvements, and submit a pull request. Contributions are always welcome!
This project is open-source and free to use. Modify it as you see fit!
 https://github.com/yllvar/gmgn-TrendingAnalyzer
Leave a Reply